
Cyber-attacks are taking place all over the world. Every minute different systems are getting attacked and victims are facing losses of billions of dollars.
Different companies come together to create a virtual man who shows different attacks in real time. These maps are a topic of conversation, no matter how accurate they are. Showing and displaying cyber-attacks in real time is nearly an impossible task as data takes some time to reach the destination.
We have listed some websites that let you to see cyber-attack going around the world.
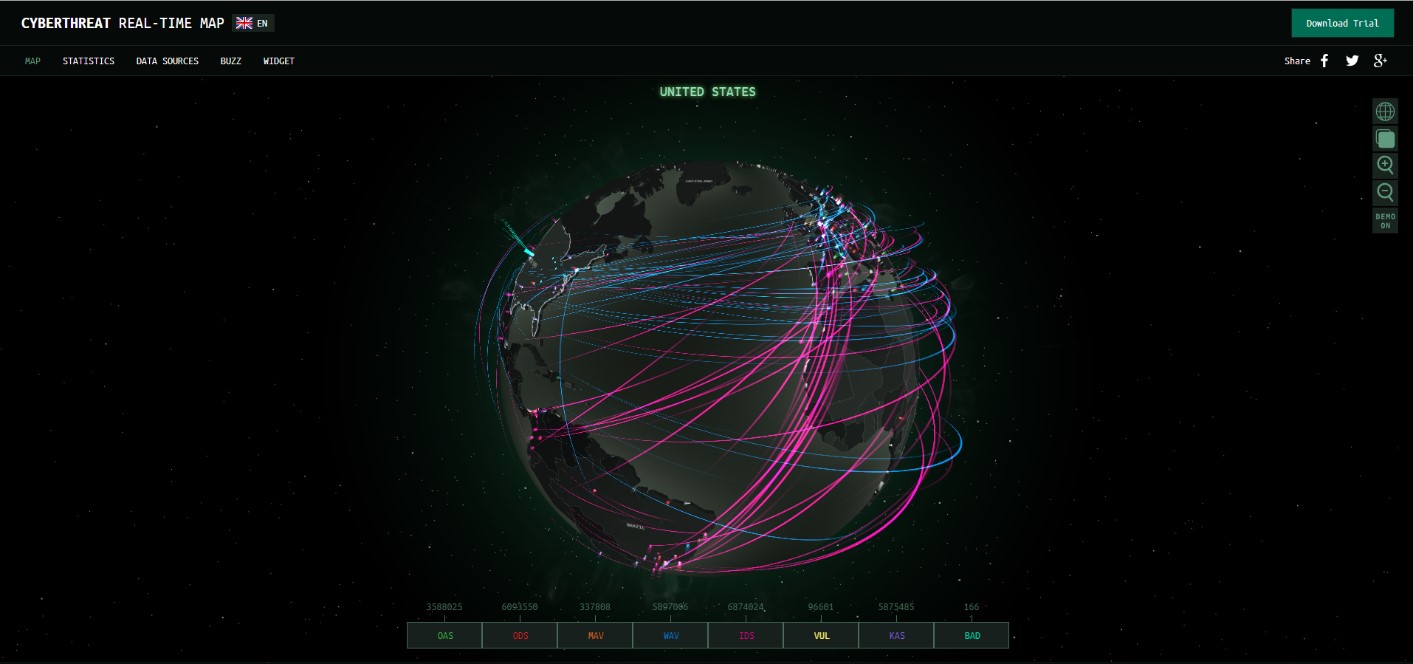
Kaspersky Cyber Map
Kaspersky Cyber Map is a great information provider. Kaspersky Map is created using real-time detection, on access scans, emails, and web detections. You can also change from globe format to plane view.
Features:
OAS – On-Access Scan
ODS – On-Demand Scan
MAV – Mail Anti Virus
WAV – Web Anti-Virus
IDS – Intrusion Detection Scan
VUL – Vulnerability Scan
KAS – Kaspersky Anti-Spam
BAD – Botnet Activity Detection
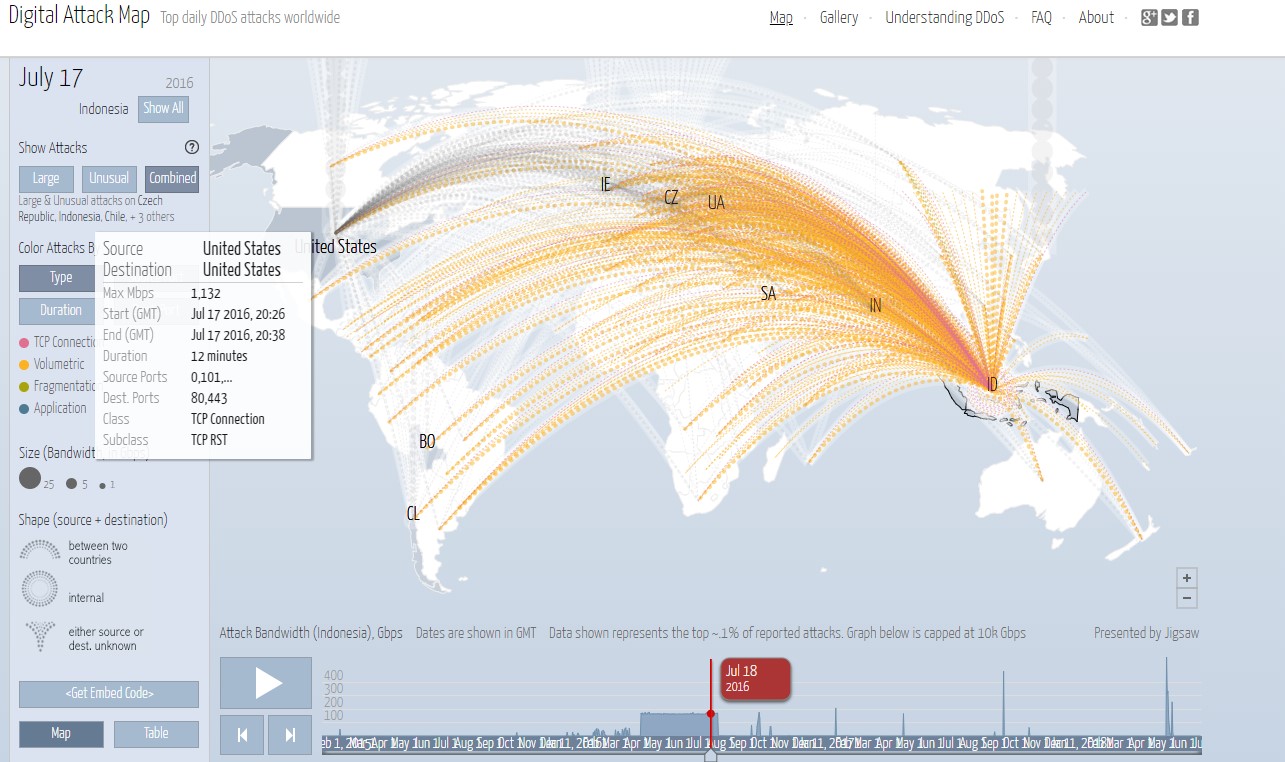
Digital Attack Map
Digital Attack Map is a live map of the DDoS attacks happening around the globe. It is a creation by Google Ideas (Jigsaw) and Arbor Networks. Data comes from different sources anonymously. You can check the data country wise and view in different colors according to type, Source port, Duration and Destination port.
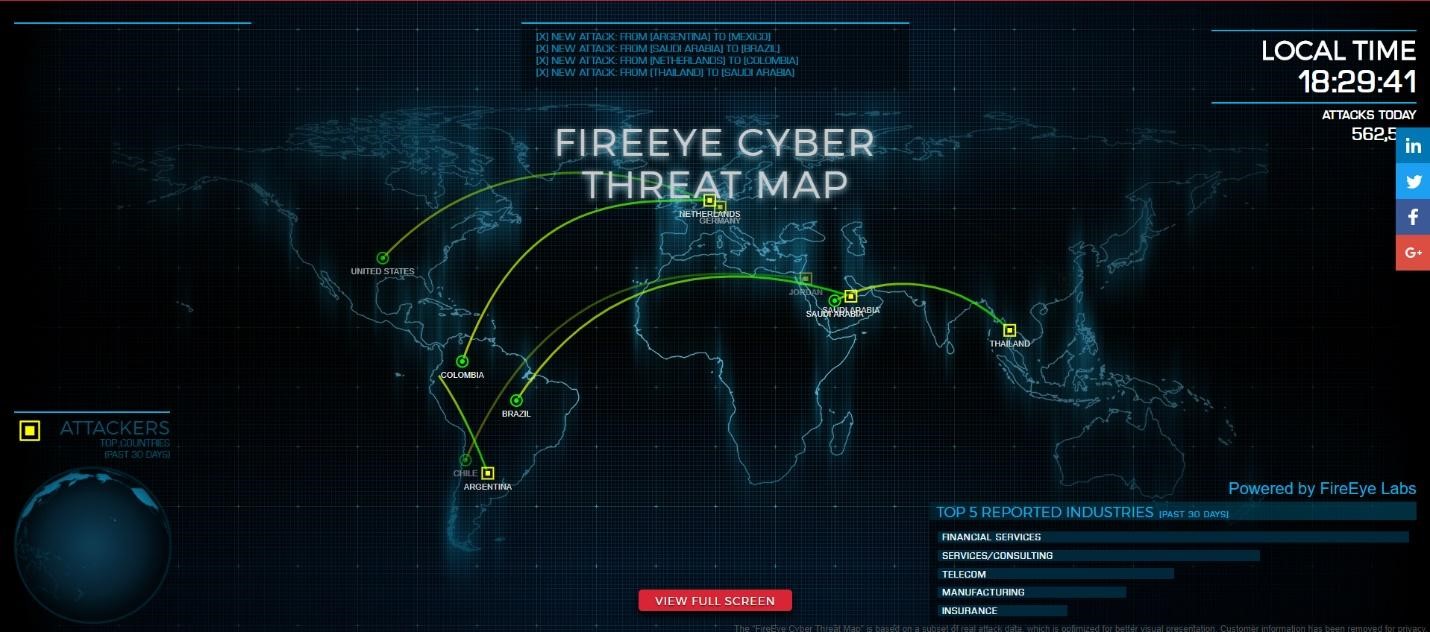
FireEye Cyber Threat Map
FireEye Cyber Threat Map shows attacks based on the summary of the attacks. These are the subsets of the real attack data make to look better visually.
This map shows you the top attackers countries for past 30 days. It also shows you the number of attacks in a day and reports about top 5 industries. It gives you a nice summary of total attacks today with following data.
Also Read : Must Know Facts About Mobile Spyware Apps
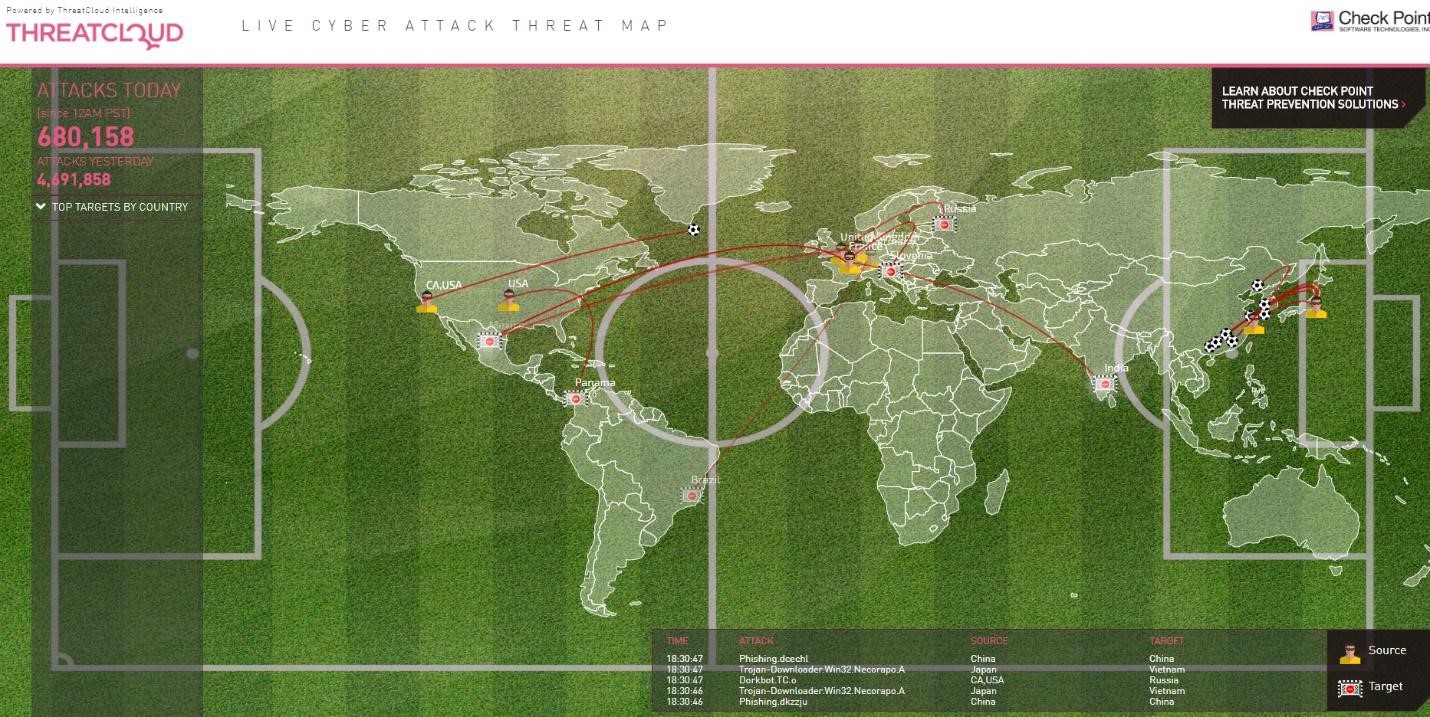
Threat Map from Check Point
Apart from live attacks, Threat Map from Check Point shows the number of attacks for today which is since 12 AM PST and top 10 countries by the target.
At the bottom, you can see the source, type of attack, and target with the time of the attack. This all information is on a simple map where source and targets are shown.
You can also check the stats of individual countries in which you can check the status of Last Week and Last Month, Average Infection Rate, Most Frequent Attack Source and Infecting Malware Types.
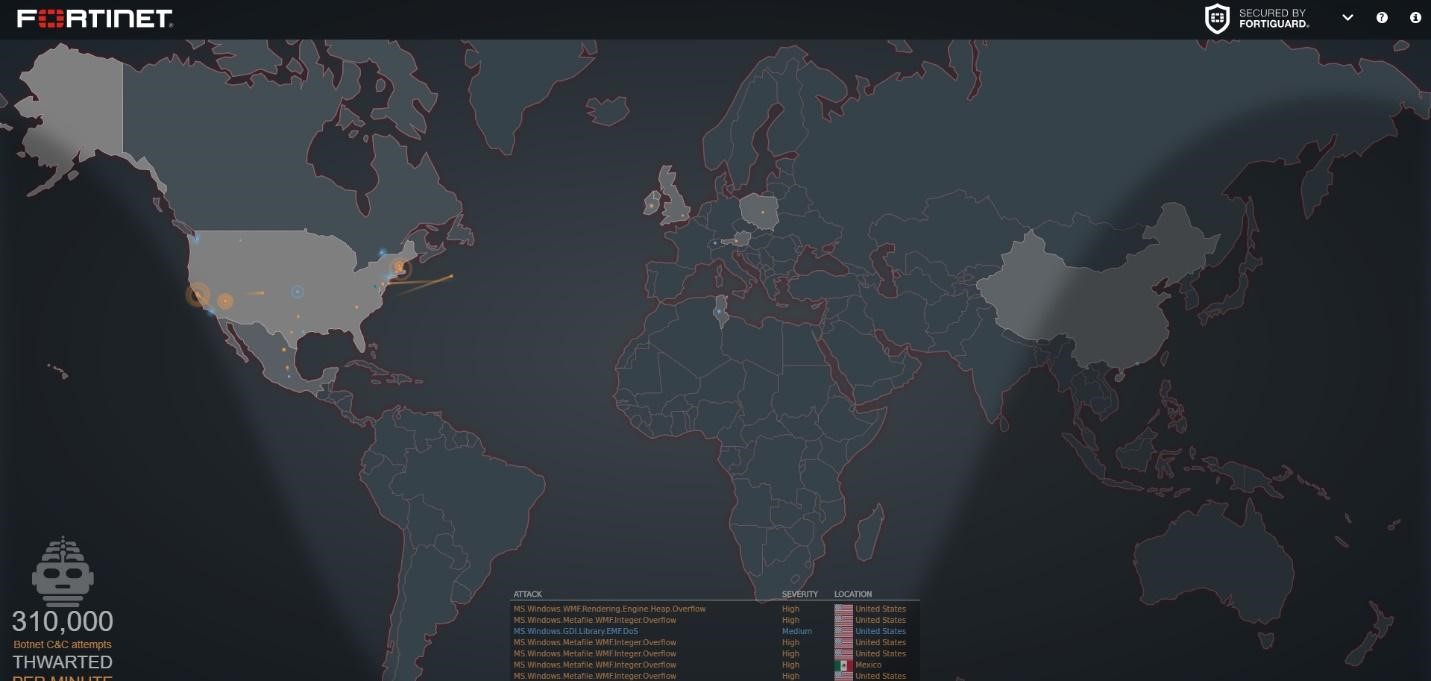
Fortinet
Fortinet threat map shows the cyber-attacks on a plain map. You can click on different countries to check the overall status and shows different attacks like Remote execution attacks, Memory related attacks, Attack from a remote location, Denial of Service attacks and Generic attacks.
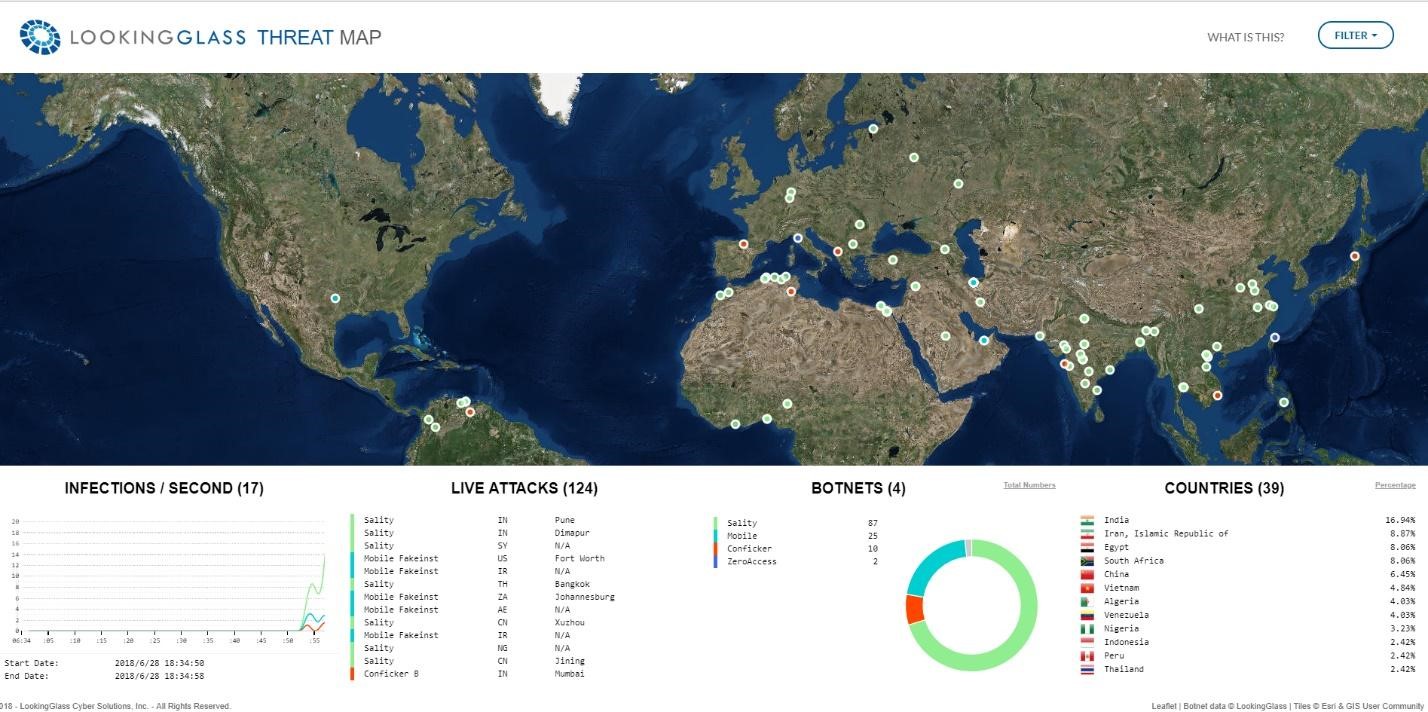
LookingGlass Threat Map
LookingGlass Threat Map shows botnet cyber-attacks happening around the world. Attacks are shown by the small dots on a map. When you click on a map it shows details of that particular attacks. On this map, you will find all the information on a panel below which shows Infections/Second, live attacks, BOTNETS, and Countries.
Also Read : The Correlation Between Social Media And Malware Infections
These maps are the visual representation of the cyber-attacks happening around the world. These maps provide useful information like time, place and severity of attacks. These maps are said to be the real-time representation of cyber-attacks happening around the globe, however, it is likely to be in real time as the information takes some time to move around.


Leave a Reply